MyHEAT
201-1228 Kensington Rd NW
Calgary, AB T2N 3P7
Canada
Measuring Energy Efficiency from 4,000 feet in the Air
Find out how we can collect thermal data for homes from an aircraft 4,000 feet in the air and then use machine learning to get an accurate measure for thermal efficiency.
Using thermal infrared imaging to drive energy efficiency program outcomes
As an entrepreneur offering new technology, it’s very encouraging to have a third party validate the effectiveness of your product.
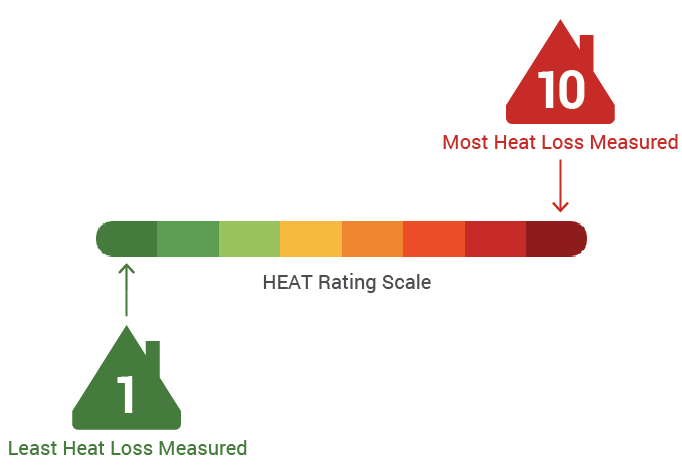
One of MyHEAT‘s main technologies is our HEAT (Heat Energy Assessment Technologies) Rating, a proprietary process that applies machine learning to generate heat loss scores for individual homes. The HEAT Rating is created using rooftop thermal signatures and comparing a building’s heat loss to others in the neighbourhood and city using a scale from 1 to 10.

Recently MyHEAT participated in a groundbreaking pilot driven by a municipally-owned utility in Alberta, in a project sponsored by Natural Resources Canada. The evaluation was led by an academic team from the University of Carleton and the University of Ottawa.
The pilot set out to measure the energy consumer’s behavioural response to thermal imagery and energy efficiency messaging. We will get into these results in a future blog post, but first, we’d like to highlight an important exercise completed in setting up the pilot.
The Correlation Between HEAT Ratings and Actual Energy Consumption
The evaluation, led by Dr. Nic Rivers and Dr. Maya Papineau, began by exploring the relationship between our HEAT Ratings and actual energy consumption data from single-family homes in the community. Data for this exercise came from three sources: MyHEAT’s HEAT rating, publicly available property tax assessment data, and energy consumption data.
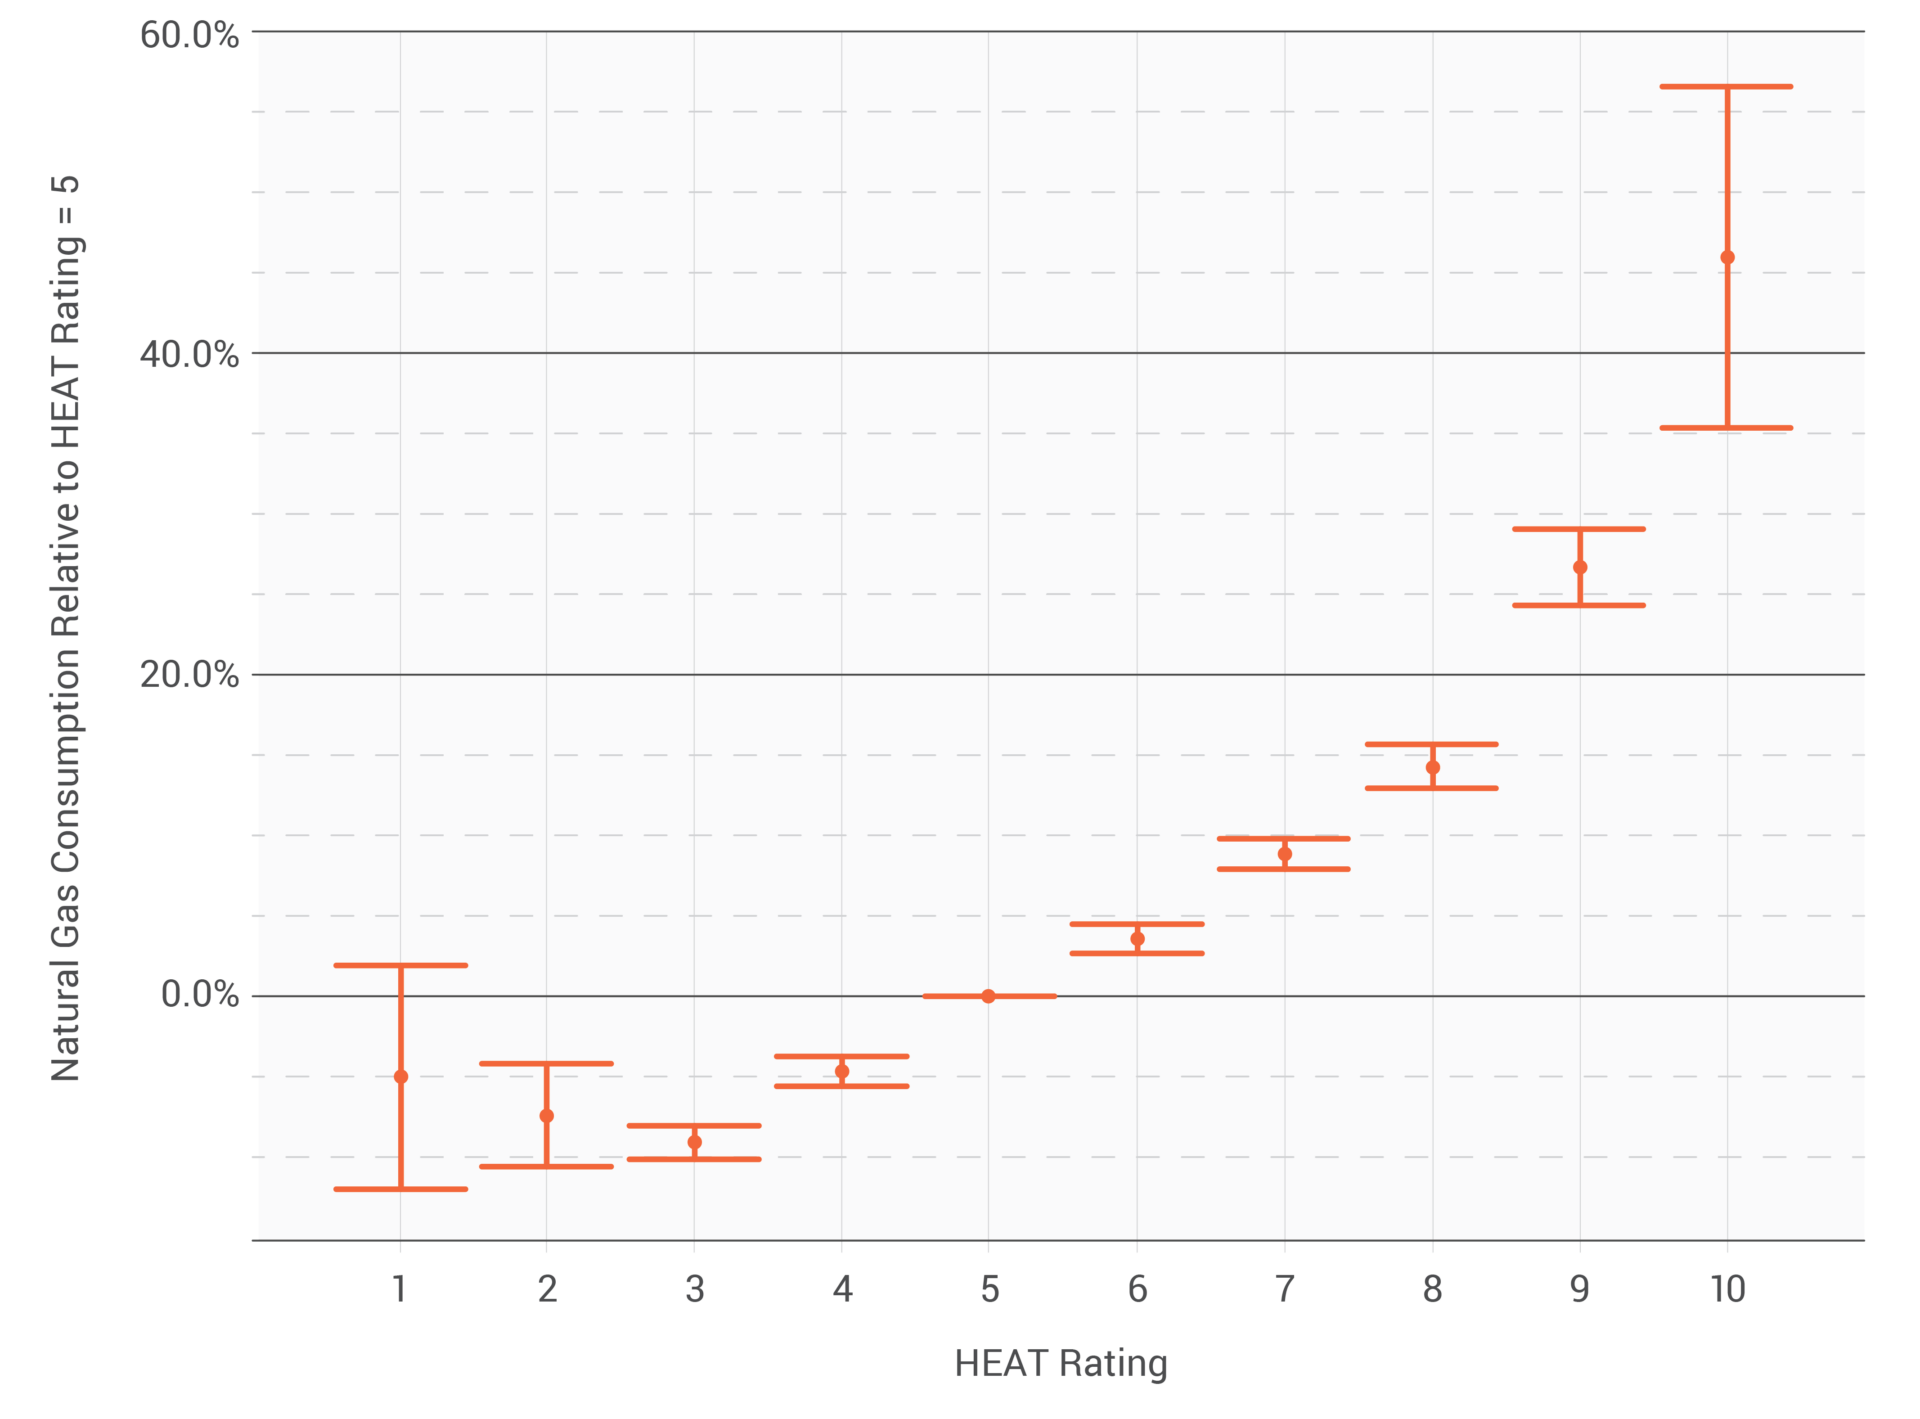
When only HEAT Rating and building size were considered, the results revealed that consumers used approximately 4% less energy for each incremental change in the HEAT Rating unit.
However, many factors influence energy consumption. To address these influences, the academic partners continued with a regression-based analysis. When the academic team used property tax assessment data (such as building type, building age, neighbourhood, etc) and energy consumption data, they estimated that each incremental change in the HEAT Rating represents a reduction in gas consumption of 3-5% and a reduction in electricity consumption of 1-1.5%.

Source: Papineau, M & Rivers, N (2019). Visualizing energy efficiency information: Evidence from a randomized controlled intervention. Unpublished raw data.
As you can see, the academic analysis clearly demonstrates that MyHEAT’s HEAT Ratings accurately reflects actual energy consumption!
So how can thermal remote sensing be used?
Well, for one, it’s amazing that we can collect thermal data for thousands of homes from an aircraft 4,000 feet in the air, and then use machine learning to derive an accurate measure for thermal efficiency, personalized for each residence. Furthermore, our method can deliver this information for less than a dollar per house, which, when compared to methods that require physical inspection and cost hundreds of dollars per home, makes MyHEAT an economical and energy efficient innovation in thermal technology.
Coolness factor aside, this also means we can use thermal remote sensing to supercharge energy efficiency efforts across the globe. A home with a HEAT rating of 1 consumes approximately 40% less energy than a building of the same size with a HEAT rating of 10.
MyHEAT’s cost-effective technique can be used to:
- Identify focus communities for energy efficiency programming
- Model energy efficiency potential and opportunities for building stock improvements
- Measure the impact of energy efficiency programs year over year
- Present energy efficiency opportunities on a map, combined with other geo-referenced datasets for market segmentation
We invite you to read more about MyHEAT analysis and investigate neighbourhood potential in our white paper, or reach out to learn more about how we can support your energy efficiency programming and deliver a turn-key product in under three months.
Written by:
Darren Jones, CEO at MyHEAT


